In the field the main difference using a film or a
digital camera is the LCD on the back of the digital camera giving you
the ability to evaluate an image right after exposure. So you might think
that watching your pictures on that small LCD is a main benefit going
digital. Ok, if you try hard you can check sharpness by zooming into
the image. The main advantage of this LCD for me is actually to check
the exposure of my last photo.
The right exposure is a key to taking quality images. This did not change
from film to digital. In some way overexposure even shows more problematic
in digital as the sensors tends to clip data above a certain threshold.
This means: never overexpose your photos. In this case, the highlights
may be lost and recovery is not possible (some techniques to estimate
lost highlight details exist though).
Here is help which only the digital cameras can provide: The cameras
provide a way to view the result of the last photograph taken and
show a histogram of the grayscale values from 0 (black) to 255(white).
Here are four histograms examples (created in Photoshop) that show
different characteristics and show the histogram basics.
Histogram 1: Histogram indicating strong overexposure
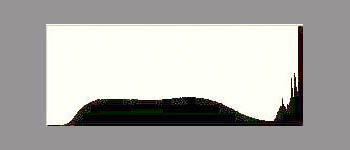
The highlights (right side of the histogram) have just been lost.
This would be a candidate for deletion in all but a few very
rare cases. Some might recommend to "burn" the photo
in Photoshop. Still that is faking details in the highlights
that are not there.
Histogram 2: Histogram indicating potential overexposure
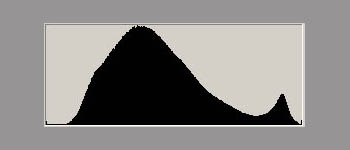
Here is only a small spike in the highlights and it very much depends
on the photo whether this might be a problem or not. If the spike
represents a real pure white or an unimportant spectacular highlight
then this photo may be OK. Otherwise, you are in trouble.
In these cases, if the camera has the ability to indicate overexposed
areas, I would recommend the user to view the cameras LCD preview
(of course with the highlight/overexposure indicator enabled).
Histogram 3: Histogram indicates good exposure
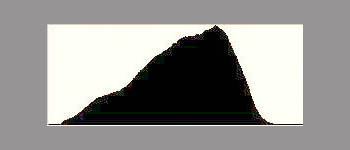
Here the highlights are OK. You lost a bit of the dynamic range
in the highlight area but Photoshop can correct for this. You should
endeavor to get histograms like this. In principle it is best to
get as close as possible to the right.
Histogram 4: Histogram indicates strong under exposure
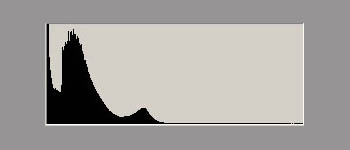
Here the data in the shadows are lost. This is not the only problem
because digital cameras show much more noise in the shadows and once
this image would be corrected extended noise would show up even in
the midrange.
“Expose to the right” rule
From the above we learned that the ideal histogram should:
• Not indicate any over exposure or highlights are lost
•
Not underexpose as you may lose shadow details but also most importantly
get more noise
In conclusion the perfect digital exposure is as far to the right
that there is no chance of overexposure. Unfortunately the real truth
is not that easy.
The overall shape of the histogram does not matter at all as it
merely reflects the tonal distribution of the scene you photographed.
Read the next section and you will understand why it is safer to
slightly underexpose than risk any highlight clipping. Especially
as some histograms are also hard to read outdoors in bright daylight.
Note 1: There is one additional complication. The
right side of the histogram is not evaluated the same with all cameras.
Some cameras are more conservative and and show values on the right
if there can be still some highlight data be recovered. Other cameras
really clip if the values are to the right. You need to learn how
to read the histogram of your camera.
Note 2: Also the histogram in your raw converter
may be different as different raw converters may have a different
interpretation of the EV 0 point.
Color channel clipping
We mentioned that most histograms in cameras show the histogram
as gray scale levels. But as we deal with color images we have really
histograms of all three RGB channels.
Some clipping can even happen in the one or two color channels and
it might not be shown in the luminance histogram.
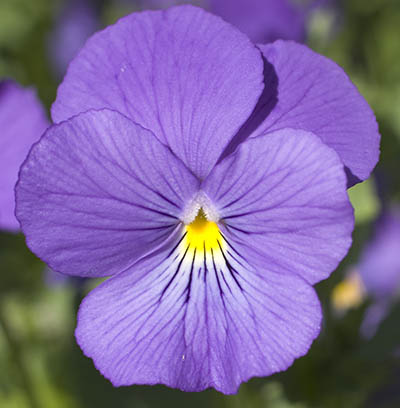
Here is an example from the Canon 10D that demonstrates typical
problem with saturated colors. Blue, orange and yellow flowers are
good candidates and it is safer not to use up the full exposure headroom
to the right.
The histogram in Camera Raw 2.2 shows clearly the challenge in the
blue channel.
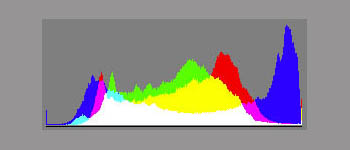
This overexposure in the blue channel was not shown by the camera
histogram as it uses an average of all the three channels (most often
they use a so called luminance histogram, where green gets valued
higher than red/blue).
In this difficult situation, it would be very helpful if you also
had histograms for the three-color channels. The only cameras we
know are the Fuji S2, Sigma SD10 amd the new Canon 1D/1Ds Mark
II. The 1D Mark II shows a histogram like this one:
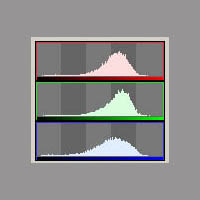
The “after” histogram
Most cameras allow you to inspect the histogram as part of the instant
preview. Here is an example from the Nikon D70:
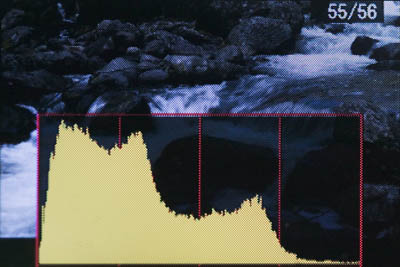
Of course, the “after” histogram only helps if you can
repeat the shot. Fortunately, in nature photography, this is often
the case except for photographing birds and other wildlife. We check
the histogram all the time. Once the exposure is right and the light
does not change we only check the histogram once in a while.
The “before/live” histogram
Ideal would be to show a live histogram and use it instead of the
camera meter. For digicams this dream actually has come to be true.
The new 8MP Konica Minolta DiMAGE, Sony F828 and Olympus 8080 all
sport live histograms.
Here is a shot from the LCD of the A2:
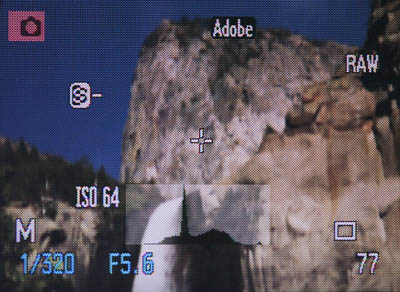
Implementing live histograms in digital SLRs will be more tricky
as the sensor is hidden by the mirror. One thing is for sure refined
versions of live histograms is the way to go.
Do we really need the histogram?
What we actually need from the histogram is the information about
under/over exposure. If this can be presented with other means then
the histogram may get obsolete. For now the histogram is your ticket
to a better exposure.
|